- 1. Collection & Processing of Deep Sequencing Datasets
- 1.1 Data Collection
- 1.2 Data Processing
- 2. Search Data using Keyword
- 2.1 Basic Search
- 2.2 Advanced Search
- 2.3 Search Output
- 3. miR-seq Browser
- 3.1 Select a miRNA & Deep Sequencing Datasets for Displaying
- 3.2 Main Features and User Interface
- 4. miR-target & Expression
- 4.1 Correlation Heat Map
- 4.2 Network Viewer
- 5. Gene Set Analysis (GSA)
- 1. Collection & Processing of Deep Sequencing Datasets
- 1.1 Data collection
-
Human deep sequencing datasets (miR-seq) are collected from GEO, SRA, and TCGA archives. Additionally, we added the expression profiles of miRNAs and mRNAs in cancer samples from the TCGA archive. TCGA data are also used to investigate the expression correlation of miRNAs and their target mRNAs. All GEO/SRA experiments and TCGA data were manually annotated into tissue and disease types using the controlled vocabulary of eVOC and MeSH, respectively.
The miRNA deep sequencing data were aligned to the reference human genome using Bowtie after trimming adaptor sequences by Cutadapt. Up to 2 mismatches were allowed during the alignment. Short reads mapped onto the known miRNA loci from miRBase or ncRNA region from Ensembl were classified as miRNA or ncRNA reads, respectively. Remaining reads were used to predict novel miRNAs using miRDeep2.
-
Back to top
- 1.2 Data Processing
-
Our analytic pipeline for small RNA-Seq data set consists of four steps: preprocessing, mapping, classification and quantification. In the preprocessing step, the adaptor sequences are removed by Cutadapt(version: 1.1) using default options. After the removal of adaptor sequences, the reads of the length <= 15 or >= 30 are removed because those reads are not likely to originate from mature miRNAs. Then duplicate reads are removed and the resulting unique reads are written in FASTA format. The header line of the FASTA file looks like "'>ATGC_x10", which indicated the read count of this unique read is 10. In the mapping step, these unique reads are aligned to the reference human genome (hg19) using Bowtie program (version: 0.12.7) using the parameter option "-a -v 2". In the classification step, the reads mapped to the known miRNA loci defined by miRBase(v18) were classified as miRNA reads. Likewise, ncRNA region by Ensembl(release 67) were classified as ncRNA reads. The comparison was done using intersectBed in BEDtools(version: 2.16.2) with the parameter option "-wa -wb -s". For the quantification of miRNAs, only the reads of perfect match with a known miRNA sequence were considered and normalized by quantile method. The iso-miR candidate reads were defined as the reads up to 3 bases longer or shorter in comparison with a known mature miRNA sequence. The remaining reads were used to predict novel miRNAs using the mirDeep2 program(version: 2.0.0.4) with default option.
-

-
Back to top
- 2. Keyword Search
- 2.1 Basic Search
-
In the Search menu, keyword search is available for miRNA, disease, and anatomic name. The plausible terms are suggested as the user type by auto-completion mode.
- 2.2 Advanced Search
-
-
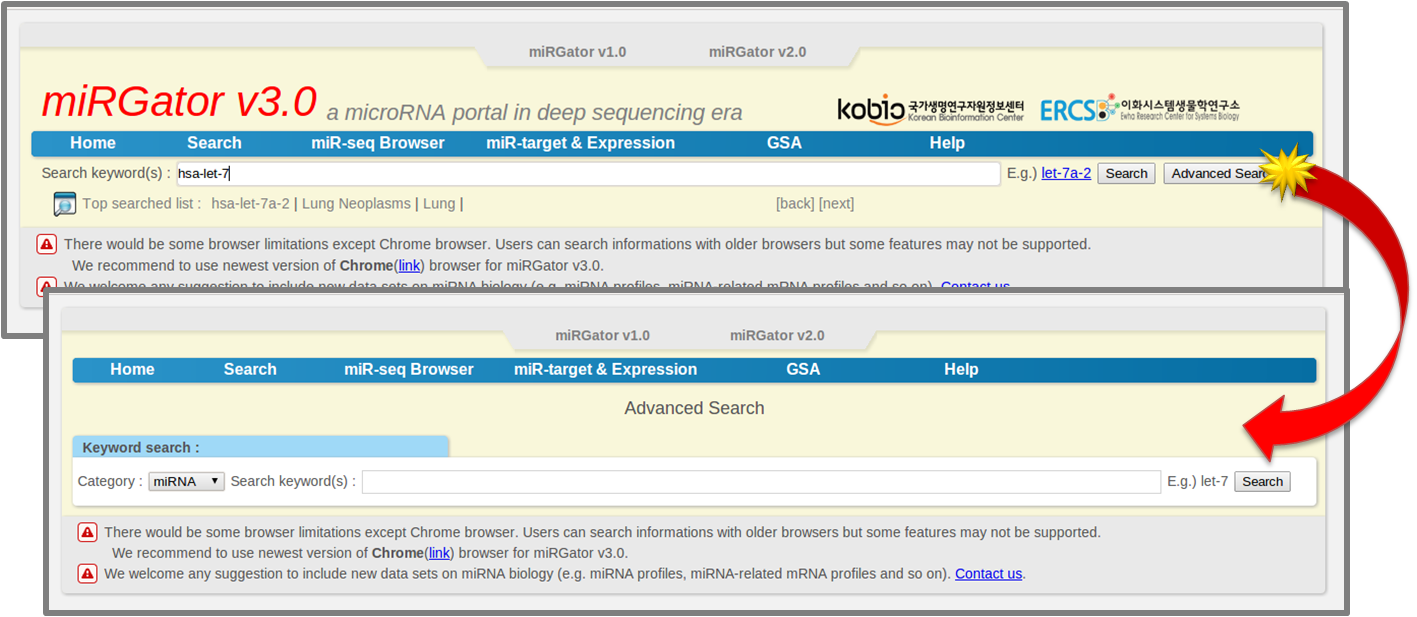
-
Back to top
- 2.3 Search Output
-
Depending on the category of query keyword, the relevant information is shown in several sections. For the query of a miRNA id, the relevant information are shown in several separate sections of miRNA Info (GeneRIF), Deep Sequencing Data Info, and the Expression of the query miRNA by disease, anatomy or organ in our dataset. If the query keyword is a disease or an anatomic term, the relevant studies are listed in the Study Info section. The differentially expressed miRNAs (DEmiRs) are displayed by clicking the 'Show DEmiR' button.
- 2.3.1 miRNA Info section
-
This section provides the basic information on the query miRNA such as accession, locus, strand, seed sequence, taxon and GeneRIF.
-

-
Back to top
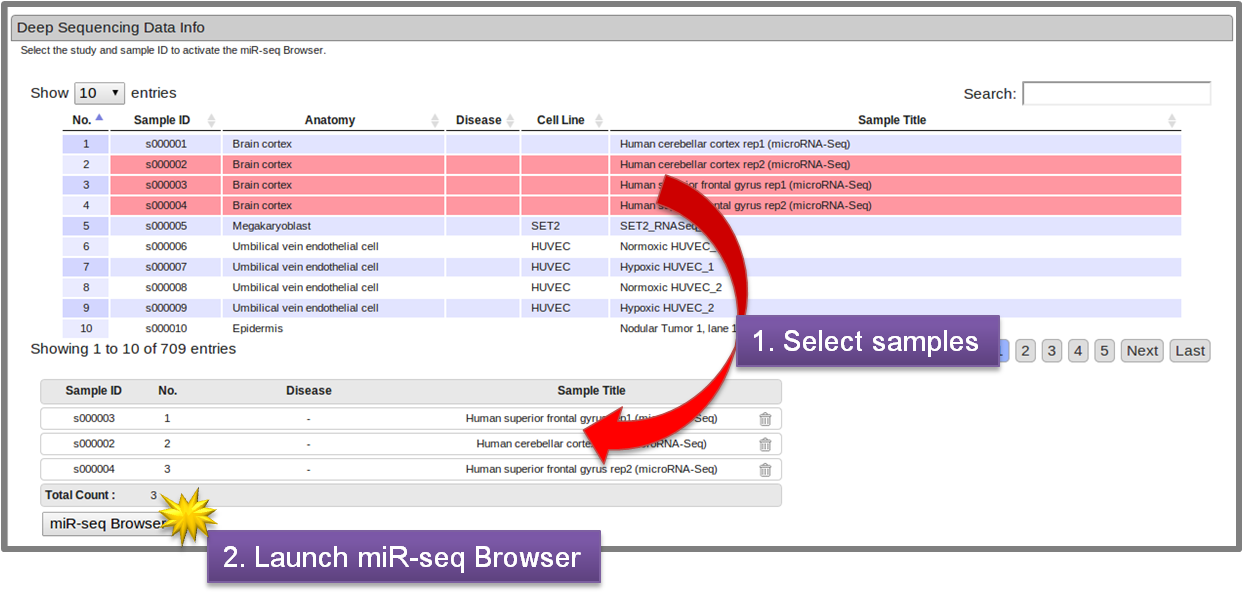
- 2.3.2 Deep Sequencing Data Info section
-
In this section, the user can also select the samples of interest, which are linked to miR-seq browser by clicking "miR-seq Browser" button for further inspection of the sequencing reads. (See 3. miR-seq Browser).
-
-
Back to top
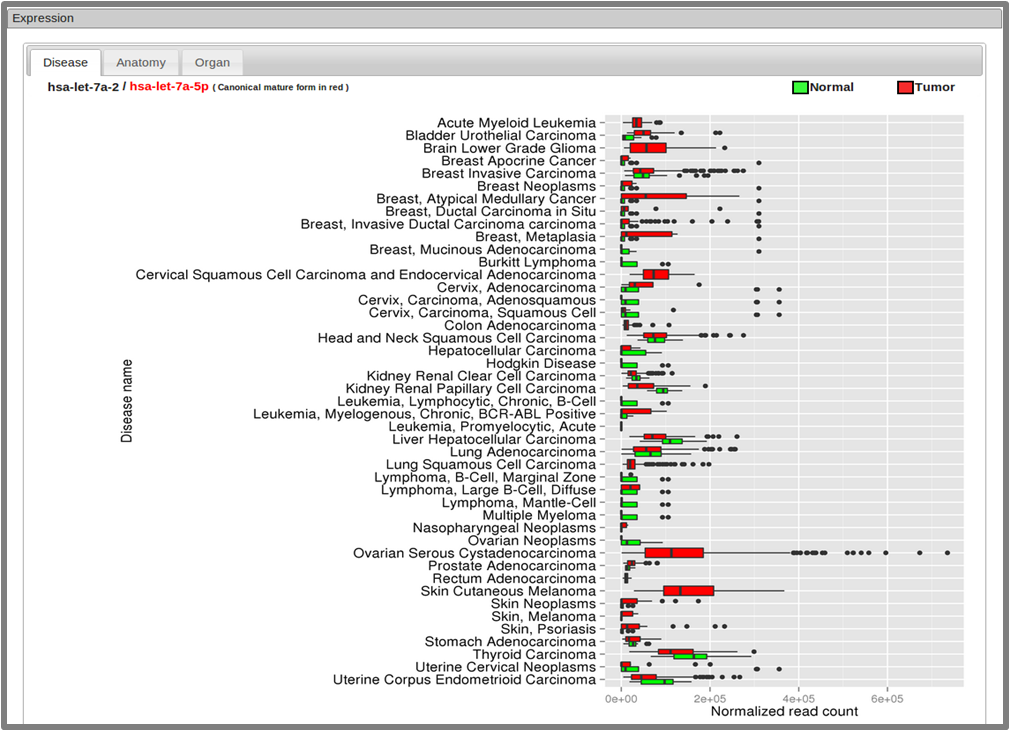
- 2.3.3 Expression section
-
The expression levels of each miRNA show expression level of varioues disease and tissue types in boxplot.
-
-
Back to top
- 2.3.4 Study Info and DEmiR Analysis section
-
The deep sequencing datasets are manually annotated according to disease or anatomic region using eVOC and MeSH terms. When the query is for a disease or an anatomic term, the relevant studies are listed in the Study Info section. The differentially expressed miRNAs (DEmiRs) are displayed by clicking the 'Show DEmiR' button.
-

-
Back to top
- 3. miR-seq Browser
- The miR-seq browser was specifically designed to examine the sequence alignment and normalized read counts with the secondary structure information in an intuitive and interactive fashion. Short reads related to iso-miRs and miRNA editing can be readily identified with the corresponding expression values (read counts) in multiple samples. This can be of great help for scientists studying biological roles of iso-miRs and miRNA editing.
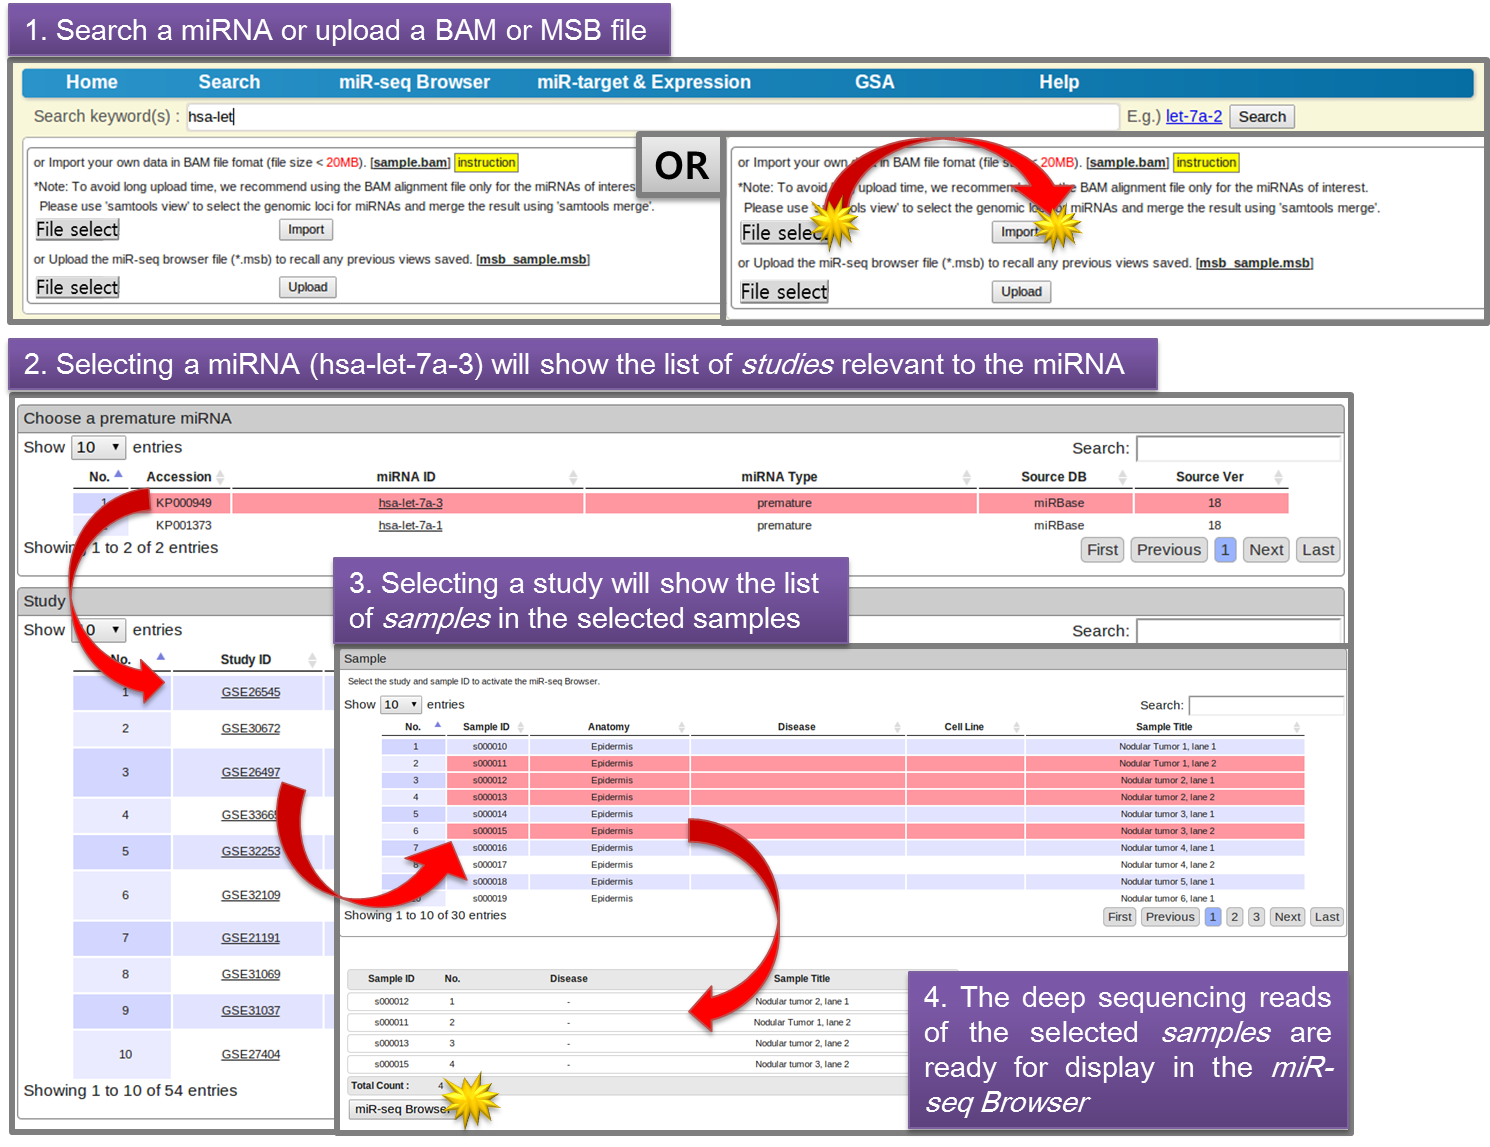
- 3.1 Select a miRNA & Deep Sequencing Datasets for Displaying
-
The user can search a miRNA of interest, and then select a study and its samples sequentially for visualizing in the miR-seq Browser. Alternatively, a BAM file can be uploaded for displaying in-house deep sequencing reads. Clicking "miR-seq Browser" button will launch miR-seq Browser.
-
-
Back to top
- 3.2 Main Features and User Interface
-
The user interface of miR-seq Browser is similar to other genome browsers such as UCSC or Ensembl Genome Browser except that miR-seq browser is specialized for visualizing miRNA short reads. The miR-seq browser is divided into several panels, which shows information on miRNA locus, miRNA secondary structure, the sequences of unique reads and their counts. The user can navigate or zoom in/out the miRNA locus. The number of mismatches can be set (default is zero) by the user. The mismatched nucleotide is shown in red (not shown in the following example because the allowed mismatch is set to zero). The pre-miRNA is divided into 5 segments of 5'-upstream, 5' mature miRNA, loop region, 3' mature miRNA, and 3'downstream by secondary structure. By clicking/hovering on a nucleotide in the secondary structure panel, the corresponding column is highlighted synchronously in the bottom panels. The reads can be re-ordered by the read count or by drag & drop of each read. This way, the user can focus on the reads of interest (e.g. frequent reads). The iso-miRs or miRNA modifications can be visually inspected quantitatively in the selected studies/samples or the uploaded deep sequencing data (BAM format).
-

-
Back to top
- 4. miR-target & Expression
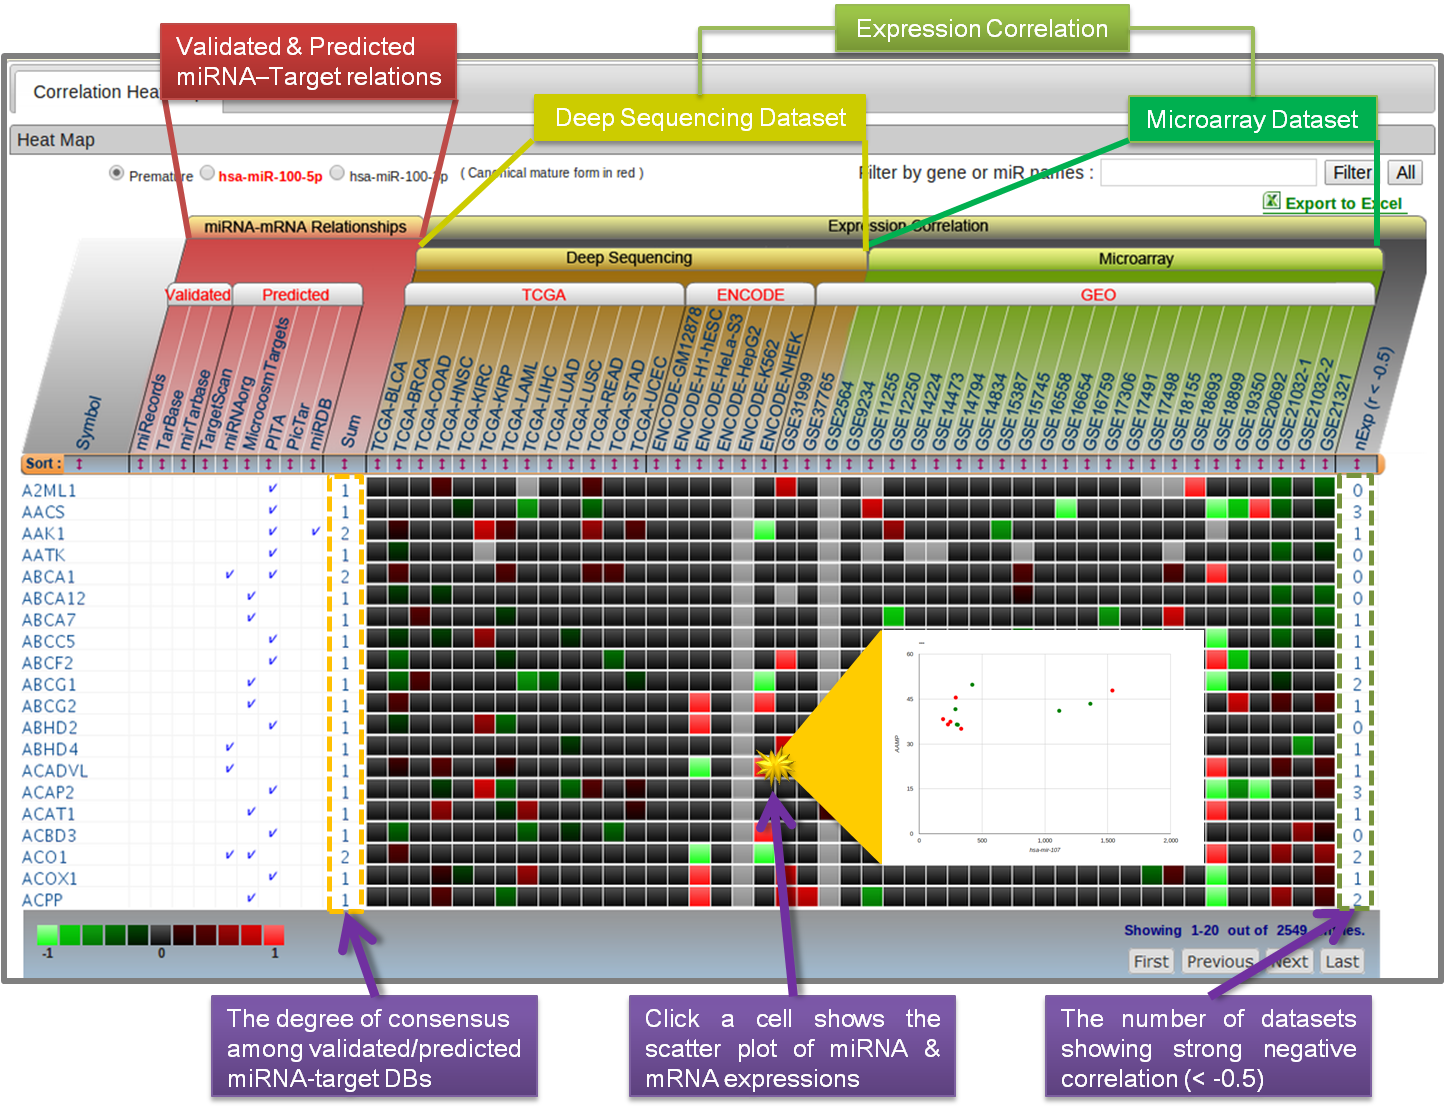
- In the menu, the user can search a miRNA or a Gene to inspect miRNA-target relationship using the datasets from validated and predicted miRNA-target databases. If the query is a miRNA, the candidate target genes are listed (vice versa). Expression correlation is useful information to discern between direct and indirect/false targets because inverse correlation suggests effective targeting relationship. Accordingly, we collected a series of expression profiles of both miRNAs and mRNAs for the same set of samples (= paired expression profiles for miRNA and mRNAs) and calculated Pearson correlation coefficient for all the datasets collected.
- 4.1 Correlation Heat Map
-
With the heat-map view, the user can inspect both miRNA-target relations and expression correlations simultaneously for all the dataset collected. The putative targets (miRNAs) can be ordered according to the degree of consensus among miRNA DBs or by the number of datasets showing strong negative correlation (< 0.5). To examine the correlation in an individual dataset, clicking a cell will show up the corresponding scatter plot of miRNA & mRNA expression values in a separate window.
-
-

-
Back to top
- 4.2 Network Viewer
-
Network view shows the target relationship in the graph visualization format. The query miRNA (or Gene) is centered and the target genes (or miRNAs targeting the query gene) are displayed on the periphery. The user can select the data sources of miRNA-target DBs and expression datasets/samples for displaying edges (miRNA-target) and coloring nodes (expression level or fold change).
-

-
Back to top
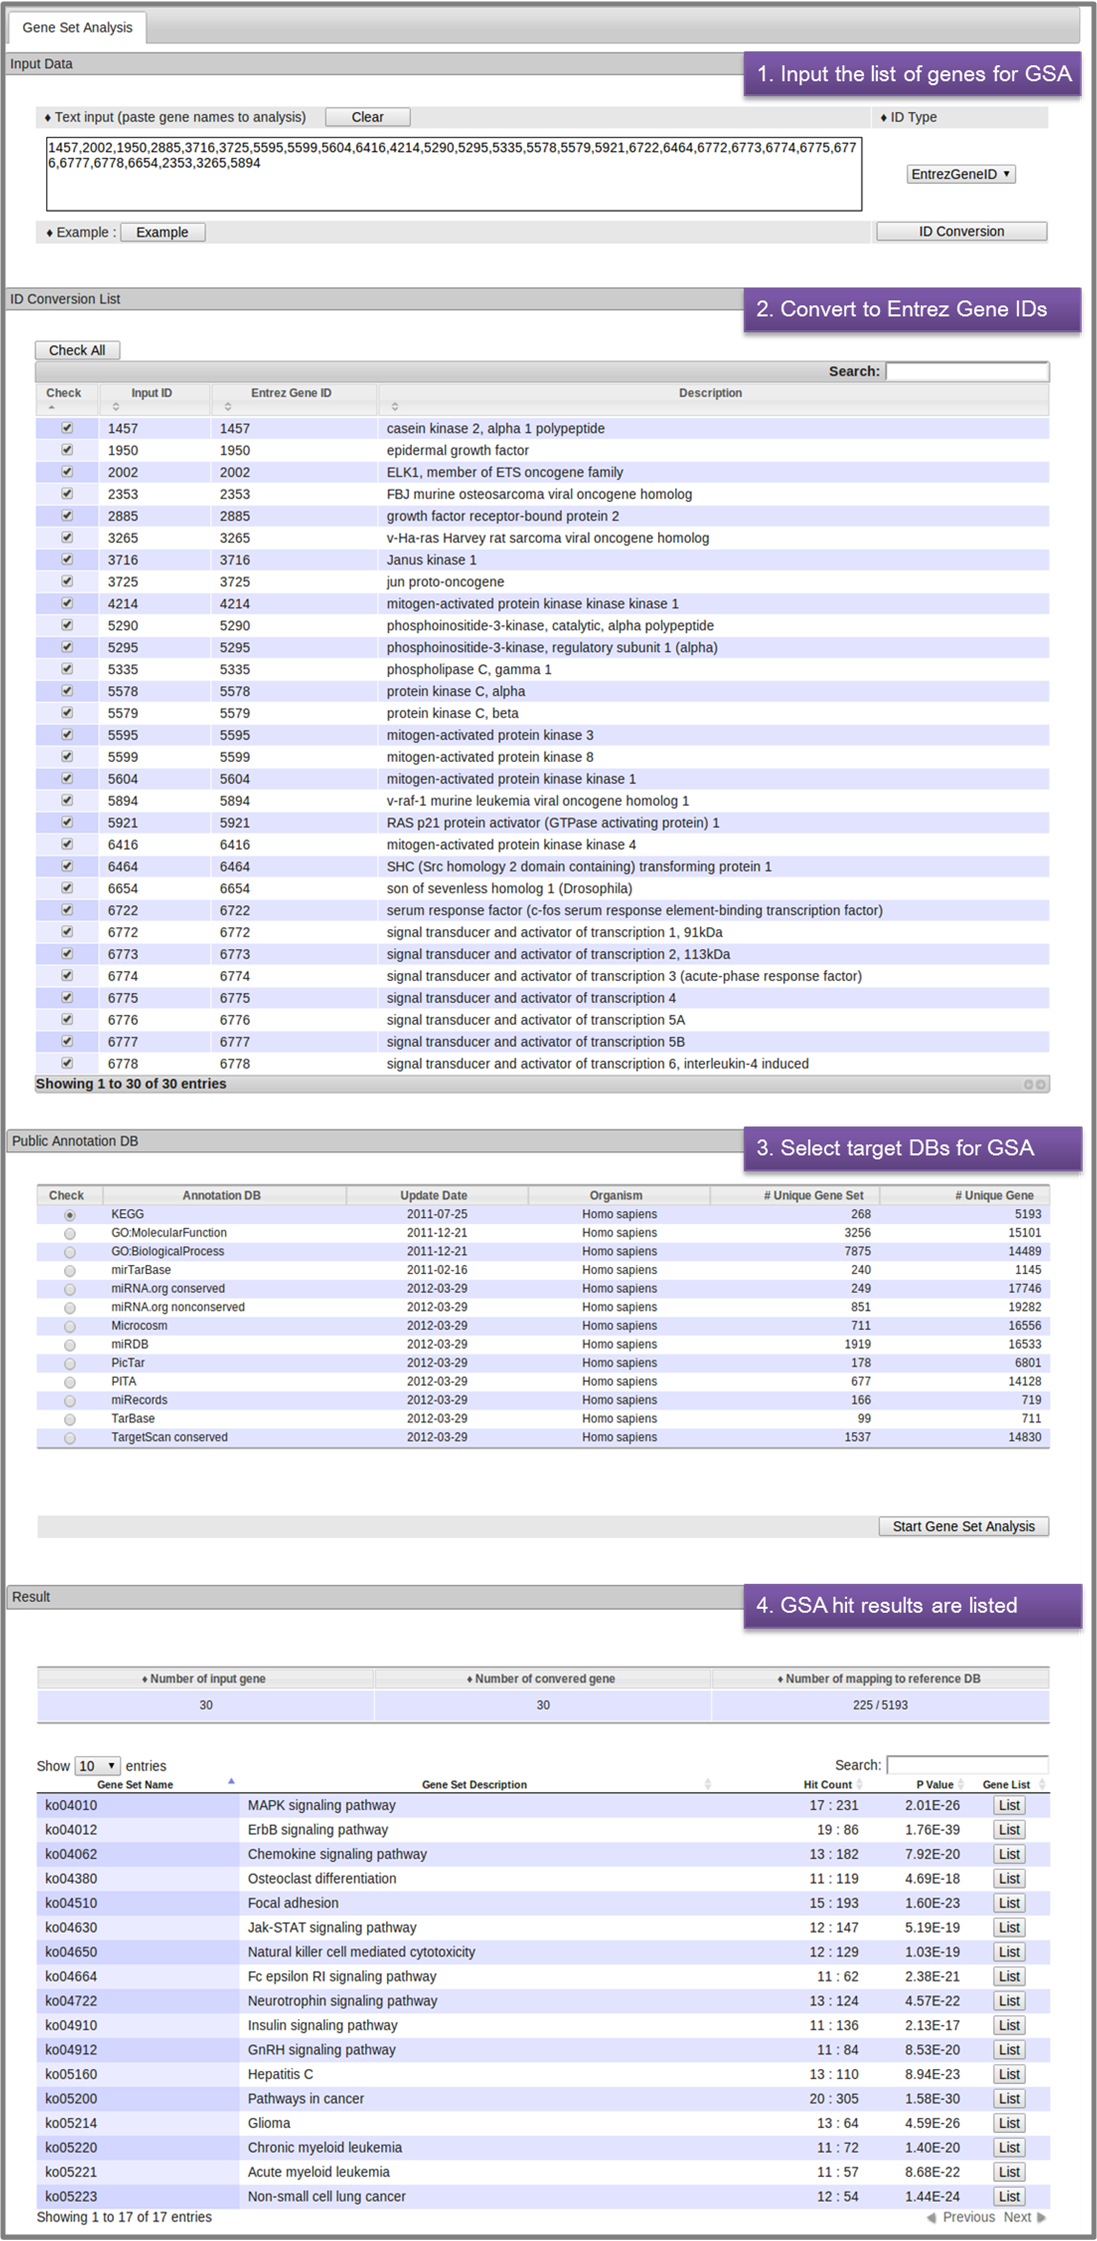
- 5. Gene Set Analysis (GSA)
- The GSA module allows the user to enter a list of genes and perform GSA for statistical enrichment. Most representative gene IDs are cross-referenced and automatically converted to the miRBase or NCBI entrez gene IDs. The user selects target DBs for GSA and click the "Set analysis" button. The GSA hit results are shown in a separate table, which is also available for download.
-
-
Back to top
|
GEO |
SRA |
TCGA |
Total |
| Curation |
No. of studies |
44 |
10 |
19 |
73 |
| No. of samples |
660 |
56 |
3,949 |
4,665 |
| No. of anatomies |
54 |
15 |
18 |
71 |
| No. of diseases |
26 |
4 |
17 |
38 |
| Mapping |
No. of total reads |
3,651,203,657 |
545,986,295 |
- |
4,197,189,952 |
| No. of trimmed reads |
2,704,297,513 |
147,800,838 |
- |
2,852,098,351 |
| No. of mapped reads |
2,129,934,409 |
392,826,996 |
- |
2,522,761,405 |
| No. of mapped reads to miRNAs region |
1,663,515,565 |
286,992,242 |
- |
1,950,507,807 |
| No. of mapped reads to ncRNAs region |
108,819,368 |
20,060,074 |
- |
128,879,442 |
| No. of mapped reads to genomics region |
191,686,502 |
22,757,497 |
- |
214,443,999 |
| Processing Result |
No. of pre-miRNA |
1,522 |
1,429 |
747 |
1,522 |
| No. of mature miRNAs |
1,843 |
1,661 |
934 |
1,856 |
| No. of ncRNAs |
6,421 |
6,286 |
- |
6,424 |
| No. of predicted pre-miRNAs |
286 |
69 |
- |
304 |
| No. of predicted mature miRNAs |
475 |
94 |
- |
508 |
|

